Deploying a connector
In this task, you deploy a minimal connector with a configuration endpoint that defines just one service. This is the minimum required for any connector to interact with the i2 Connect gateway.
If you have any issues during this task, the troubleshooting guide might be helpful.
Prerequisites
Before you start, ensure that you have:
- deployed i2 Analyze with the i2 Connect gateway, and
- defined a schema to model the data, and
- installed Analyst's Notebook and connected it to your i2 Analyze deployment
Adding the connector to the i2 Analyze topology
This is how to configure the i2 Analyze server so that it knows about your connector.
Add the connector to the topology.xml
- In the
i2analyzedirectory, navigate to thetoolkit\configuration\environmentdirectory and open thetopology.xmlfile in a text editor. In the
opal-services-daod<war>element, if it is not already there, add a<connector-ids>element. Inside that, add a<connector-id>element with avalueattribute that matches the unique identifier of your connector. For example:<wars> <war ... name="opal-services-daod" ... > ... <connector-ids> <connector-id value="nypd-connector"/> </connector-ids> ... </war> </wars>Inside the
<topology>element, add a<connectors>element. In here, add a<connector>element withid,name, andbase-urlattributes. Choose whateveridandnameyou like, but set thebase-urltohttp://localhost:9081/. For example:<ns1:topology ...> ... <connectors> <connector base-url="http://localhost:9081/" name="NYPD Connector" id="nypd-connector"/> </connectors> </ns1:topology>Note: If you have configured the schema as a gateway schema in the previous step of the walkthrough, you must add a
gateway-schemaattribute and set it to the schema short name.<ns1:topology ...> ... <connectors> <connector base-url="http://localhost:9081/" name="NYPD Connector" id="nypd-connector" gateway-schema="NYPD-Complaints"/> </connectors> </ns1:topology>For more information on gateway schemas, see the documentation here.
Reload the i2 Analyze configuration
For these changes to take effect, you need to update the i2 Analyze connectors configuration and use the Admin Console to reload it.
Navigate to
i2analyze\toolkit\scriptsin your console and run:setup -t updateConnectorsConfigurationOpen a web browser and navigate to
<i2-Analyze-URL>/admin#/connectors, where<i2-Analyze-URL>is the URL used to access your i2 Analyze deployment. For example,http://localhost:9082/opaldaod/admin#/connectors.Note: For more information about the Admin Console, refer to i2 Analyze Server Admin Console.
If you are prompted to log in, enter the credentials for your default user. If you added an example user, the username and the password will be
Jenny.Click Reload gateway to enact your changes.
Verify the connector configuration
To confirm that you successfully added a connector to the topology, you can view the status of your connectors using the Admin Console. Although you don't yet have a running connector, you can test that you have configured i2 Analyze so that it can find the one you will soon create.
In the Connectors section, you can see a list of connectors that you deployed to your i2 Analyze server, and their respective statuses.
For the nypd-connector, there is an error with a message saying that i2 Analyze failed to retrieve configuration information for your connector, as shown below.
This is because the connector doesn't exist yet!
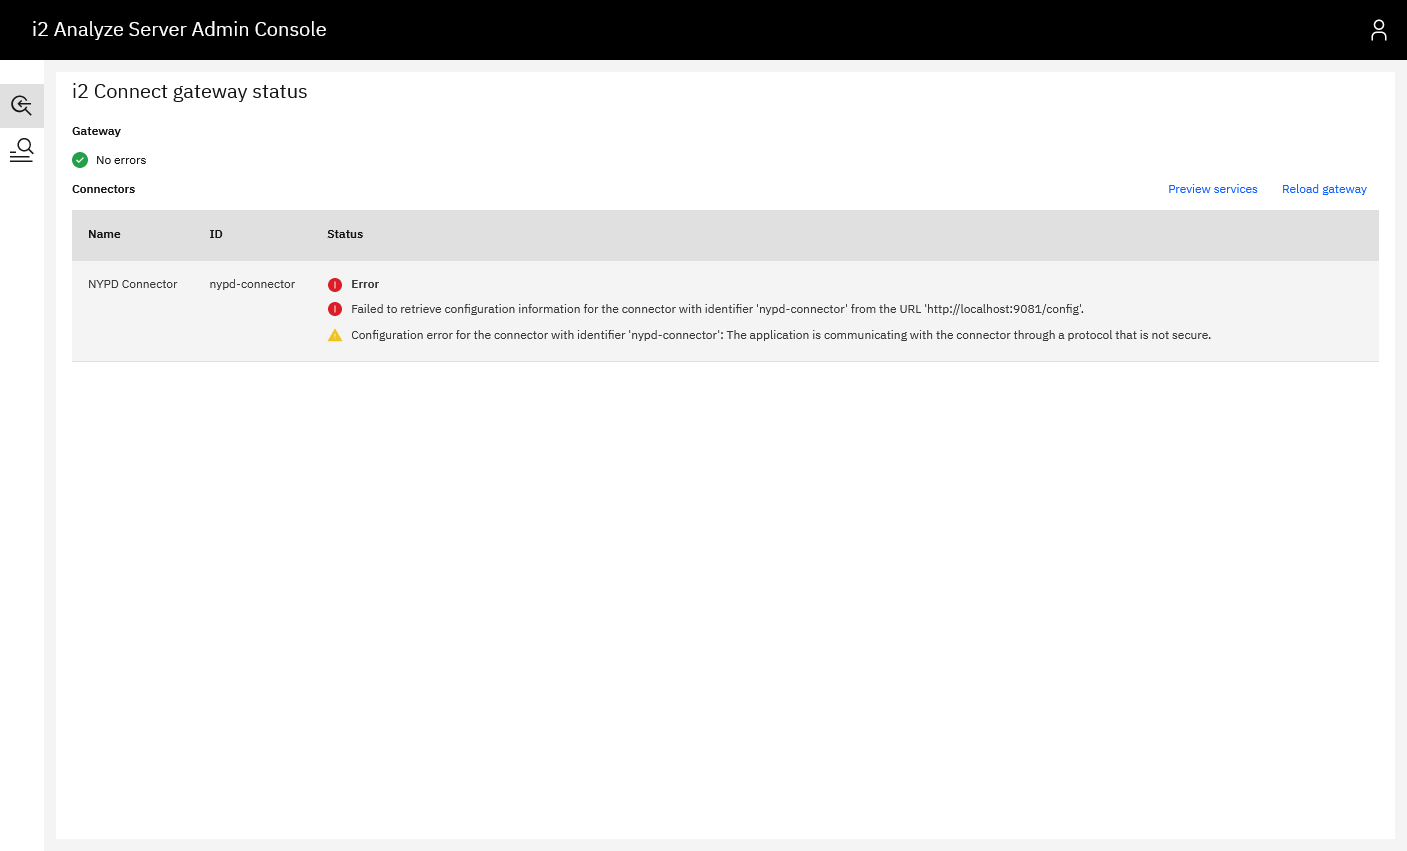
Unsecured protocol warning message
You might also see the following warning message in the Admin Console:
"Configuration error for the connector with identifier '<CONNECTOR-ID>': The application is communicating with the connector through a protocol that is not secure."
In a development environment, you can ignore this warning. It appears because i2 Analyze and your connector are communicating via HTTP rather than HTTPS.
In a production environment, you should secure this connection using HTTPS. For information about configuring the connection to use HTTPS, see Client authenticated Secure Sockets Layer with the i2 Connect gateway.
Deploying the connector
Now that i2 Analyze is expecting a connector, you had better create one! For the purposes of this guide, an example Spring Boot application is provided.
Set up the example starting point
Java
Open the example starting code from the
connector/nypd/java/templatefolder in this repository. Copy thenypd-connectordirectory to wherever you would like to work, and open it in VSCode or the IDE of your choice.Note: Ensure that the target directory contains no spaces in its path. Otherwise, you may face issues if you use the command prompt to start your connector.
Have a look at the contents:
- Resources:
config.jsonandapplication.properties - Code: a simple Spring Boot application
The
config.jsonfile tells Analyst's Notebook what services are available and how to execute them. For more information on providing this configuration, see Implementing config.The
application.propertiesfile defines the server port. In later walkthroughs, it also defines the resource URL and the API token required to connect to the resource.- Resources:
Start the connector. See running example connectors in Java.
Python
Open the example starting code from the
connector/nypd/python/template/nypd-connectorfolder in this repository. Copy thenypd-connectordirectory to wherever you would like to work, and open it in VSCode or the IDE of your choice.Have a look at the contents:
- Resources:
config.json - Code: a simple Flask application.
The
config.jsonfile tells Analyst's Notebook what services are available and how to execute them. For more information on providing this configuration, see Implementing config.- Resources:
Start the connector through the command line.
Use Postman to investigate the config endpoint
The supplied starting code has a config endpoint that is ready to use.
Using the provided Postman collections and environments, call the GET method of the config endpoint and look at the output.
Verify that it matches the contents of the config.json file that you set up earlier.
For more information on how to test your connector using Postman, see this link.
Update the i2 Analyze connectors configuration
Now that you have a connector running, you need to tell i2 Analyze to reload its connector configurations.
- In the Admin Console, click Reload gateway to configure your changes.
You can see that the "Failed to retrieve configuration" error has been replaced by another error.
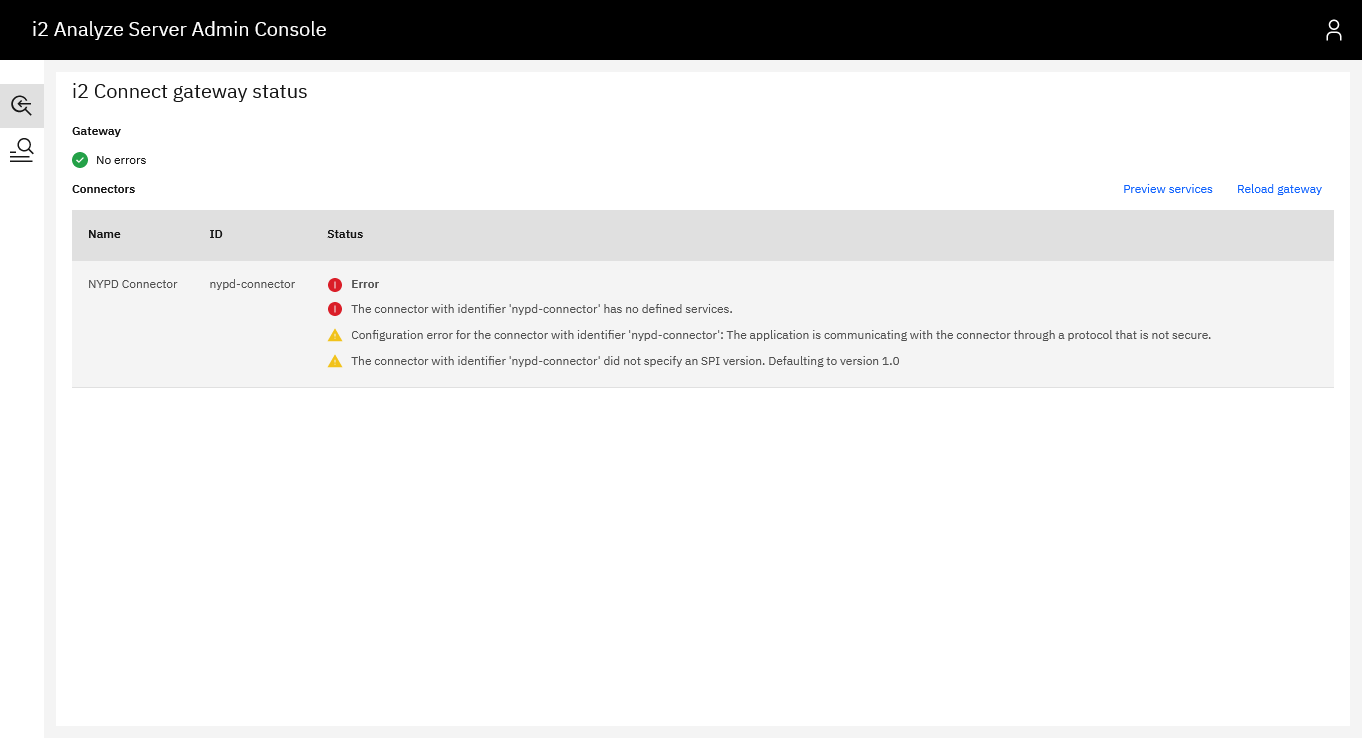
SPI version warning message
You might also see the following warning message in the Admin Console:
"The connector with identifier '<CONNECTOR-ID>' did not specify an SPI version. Defaulting to version 1.0"
To resolve this warning, the config.json file must specify the SPI version that the connector wants to use.
We will cover this setting in the next topic.
Investigate in Analyst's Notebook
Before you fix this issue, take a look at what happens when you try to use your connector from Analyst's Notebook.
- Open Analyst's Notebook and log in to the i2 Analyze server.
- In the top ribbon, click the External Searches button.
- Notice the banner at the top of the resulting window that says "Some queries are not configured correctly". This is because there are errors in your configuration, as shown in the Admin Console.
Adding a service
To enable the use of the connector, you must resolve all the errors displayed in the connector messages. The error in this instance is caused by the connector not having any services. The next step is therefore to define and implement a service.